
OpsGrid — One View of Distributed Delivery
Our proprietary operations intelligence platform unifies programs, people, and performance signals across regions.
180+ enterprises · 18 countries · 24/7 global delivery coverage
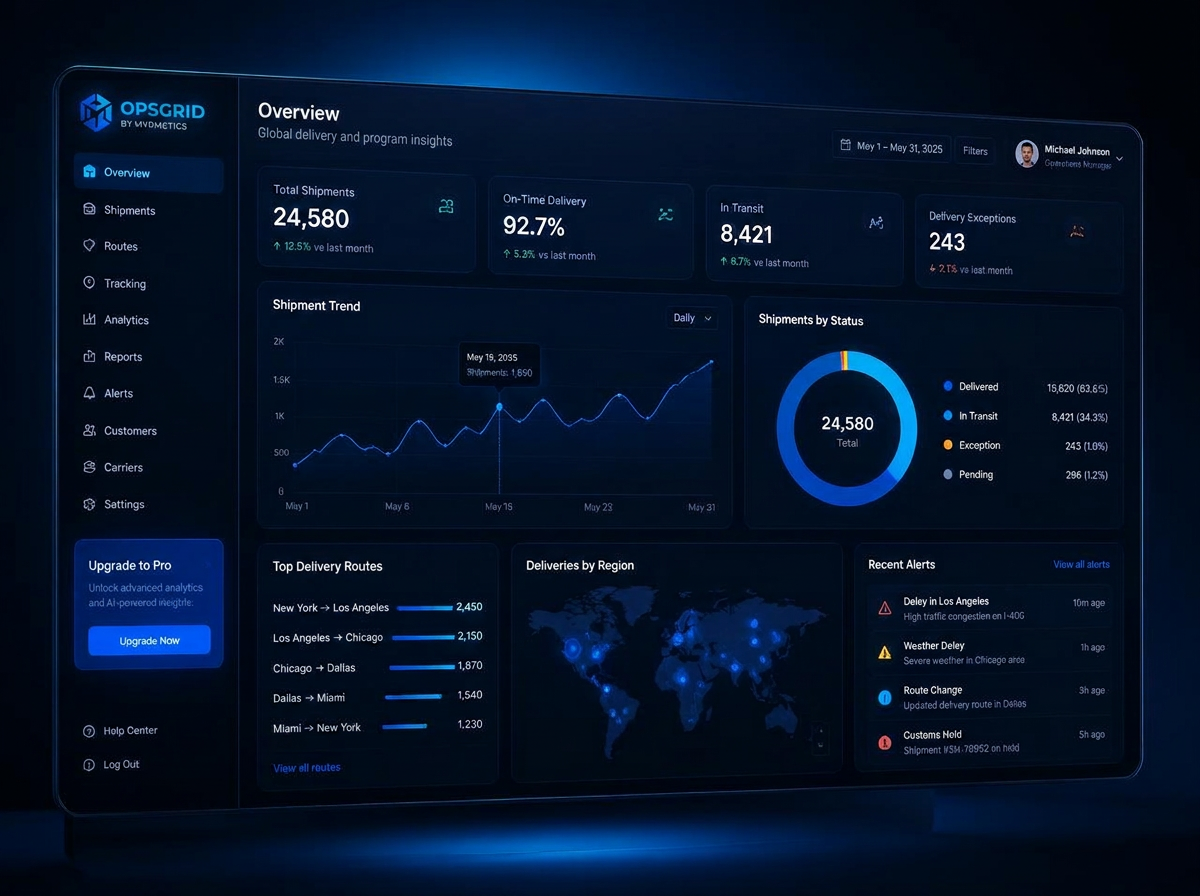
Program Health You Can Act On Same-Day
Automated status rollups, risk flags, and utilisation trends replace week-old status decks.
180+ enterprises · 18 countries · 24/7 global delivery coverage
Plugs Into Dynamics 365 and Your Existing Stack
Prebuilt connectors for ERP, HR, and finance systems so reporting reflects one version of the truth.
180+ enterprises · 18 countries · 24/7 global delivery coverage
Trusted by 180+ enterprises across 18 countries
Microsoft Solutions Partner
ISO 27001 · ISO 9001 · CMMI Level 3
Myrmetics OpsGrid
Operations intelligence for distributed enterprises — one platform to see, forecast, and govern delivery across regions, entities, and partners.
- 30 days
- Typical time-to-live
- 40+
- Prebuilt data connectors
- 1 view
- Programs, people, margin
- 99.9%
- Platform availability
Capabilities
Built for the way global delivery actually runs
Every capability comes from running live enterprise programs — not from a generic analytics template.
Unified Operations View
Consolidate ERP, CRM, and workforce data into one live picture of delivery.
Predictive Signals
Flag delivery, margin, and utilisation risk weeks before it compounds.
Native Dynamics Connectors
Certified integrations with Dynamics 365 and the Power Platform.
Enterprise Governance
Role-based access, full audit trails, and regional data residency.
Modules
Six modules, one governed data model
Start with the module that hurts most today, then switch on the rest without a re-implementation.
Program Control
Milestones, RAID logs, and same-day status rollups across every workstream.
Talent & Bench
Utilisation, ramp plans, and open-role pipelines for distributed pods.
Margin Intelligence
Revenue, cost-to-serve, and forecast variance by client and geography.
Regional Operations
Follow-the-sun coverage, SLA attainment, and escalation heat maps.
Integration Hub
Prebuilt pipelines for ERP, HRIS, finance, and ITSM systems.
Executive Briefings
Board-ready narratives generated from live delivery data, not decks.
How it works
Live in weeks, not quarters
Connect
Point OpsGrid at your Dynamics, HR, and finance sources with governed connectors.
Calibrate
Map your programs, pods, and commercial models onto our practitioner data model.
Operate
Run weekly governance on live signals — with alerts routed to accountable owners.
Built by practitioners
Designed from 150+ live enterprise delivery programs, not a generic BI template.
Deploys in weeks
Standard connectors and data models shorten implementation to under 30 days.
Priced transparently
Flat per-workspace licensing with no per-report or per-query surcharges.
Product Preview
See OpsGrid Before You Talk to Anyone
Switch between the views your teams would actually live in.
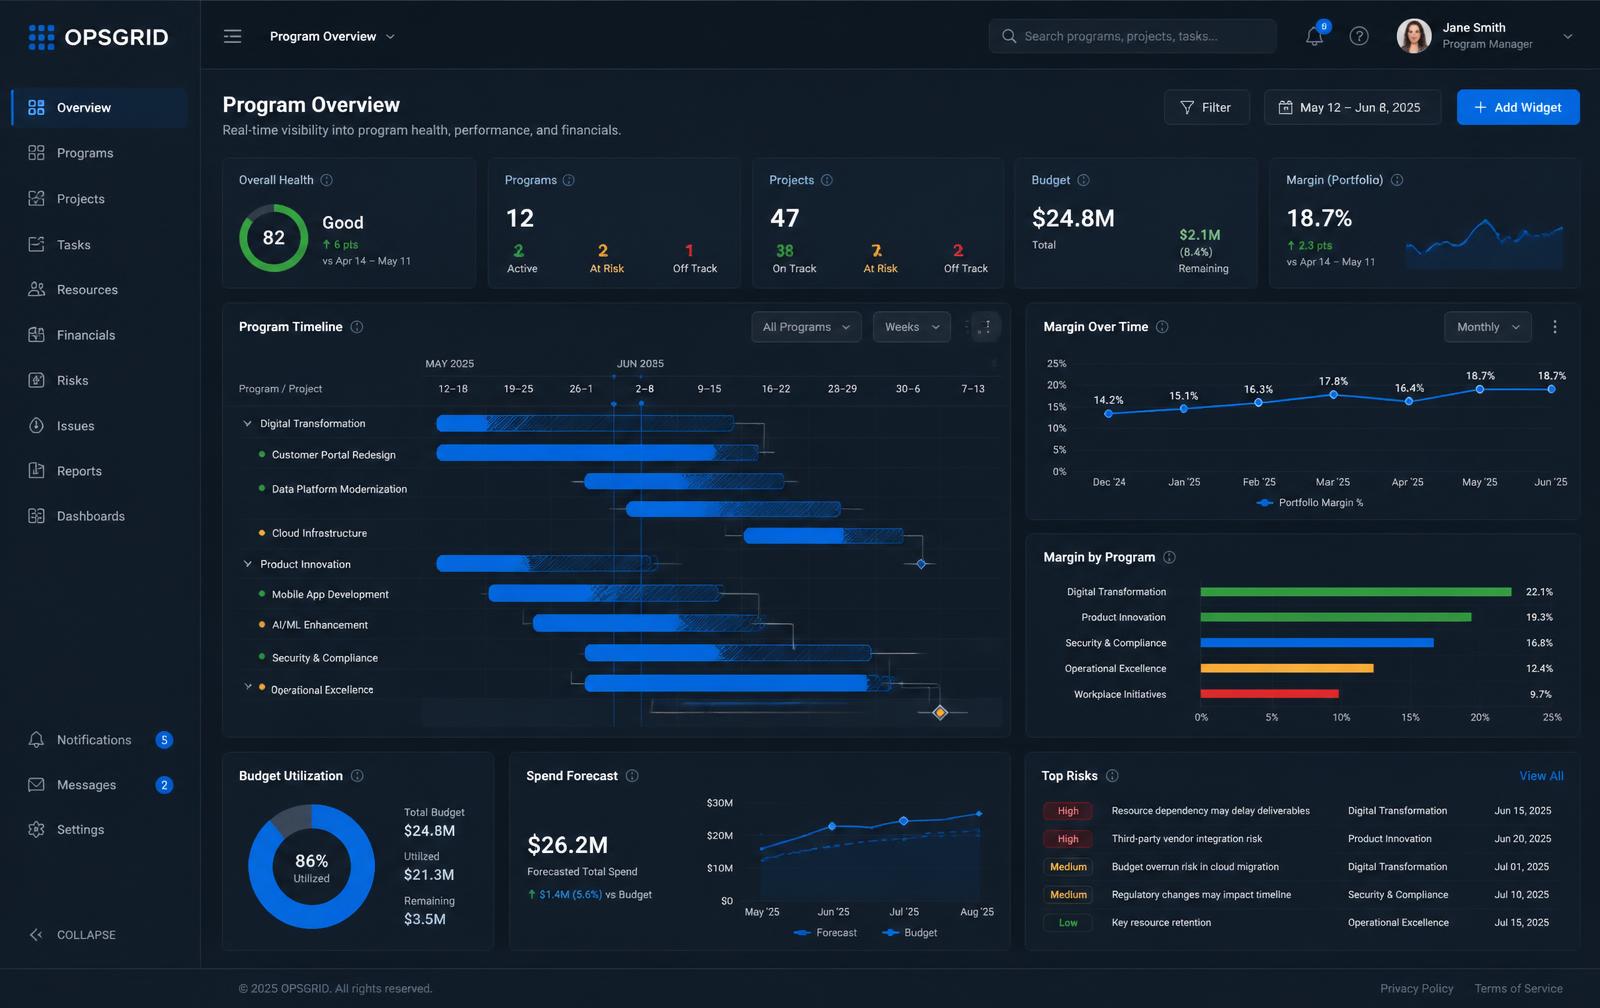
Portfolio health, timeline slippage, budget burn and top risks on one screen.
Business Benefits
What changes in the first quarter
Decisions in-week, not next quarter
Status, risk and margin refresh daily — governance meetings work on current facts.
Utilisation you can act on
Bench, ramp and demand in one view so capacity decisions stop being guesses.
Margin protected early
Cost-to-serve variance flagged while there is still time to fix the engagement.
Audit-ready reporting
Every metric traceable to source records with role-based access and full logs.
Integration Architecture
How OpsGrid connects to your estate
- 1
Sources
Dynamics 365 F&O and CE, Business Central, HRIS, finance, ITSM, Excel uploads.
- 2
Ingestion
Certified connectors and Azure Logic Apps with scheduled and event-driven sync.
- 3
Data platform
Governed delivery data model on Microsoft Fabric with regional data residency.
- 4
Intelligence
Risk, utilisation and margin models plus Copilot-style narrative summaries.
- 5
Consumption
OpsGrid workspaces, embedded Power BI, alerts to Teams and email.
Customer Use Cases & ROI
Who uses it, and what it returns
Group CIO
Sees every program's health and dependency risk across four regions in one review.
Delivery director
Rebalances pods weekly using live bench and demand signals instead of spreadsheets.
CFO
Tracks cost-to-serve and forecast variance by client, entity and geography.
PMO lead
Replaces manual status collection with automated rollups and exception flags.
- 30 days
- Typical time-to-live
- 70%
- Less reporting effort
- 6–9%
- Margin leakage recovered
- <6 months
- Typical payback period
Product Comparison
OpsGrid vs the usual alternatives
Compared with a generic BI stack or a traditional PPM tool bolted onto delivery.
| Capability | OpsGrid | Generic BI stack | Traditional PPM |
|---|---|---|---|
| Delivery, workforce and margin in one model | |||
| Native Dynamics 365 connectors | |||
| Bench and utilisation intelligence | |||
| Live risk and margin prediction | |||
| Live in under 30 days | |||
| Flat per-workspace pricing |
Metics — user & endpoint activity monitoring, made clear
Metics is a client / user monitoring platform that gives organizations clear, real-time visibility into what users are doing on company systems — application usage, web activity, working hours, and productivity trends — presented as clean, actionable analytics rather than raw surveillance logs.
- Real-time
- Activity visibility
- Win / macOS
- Endpoint support
- Cloud / on-prem
- Deployment choice
- Role-based
- Access control
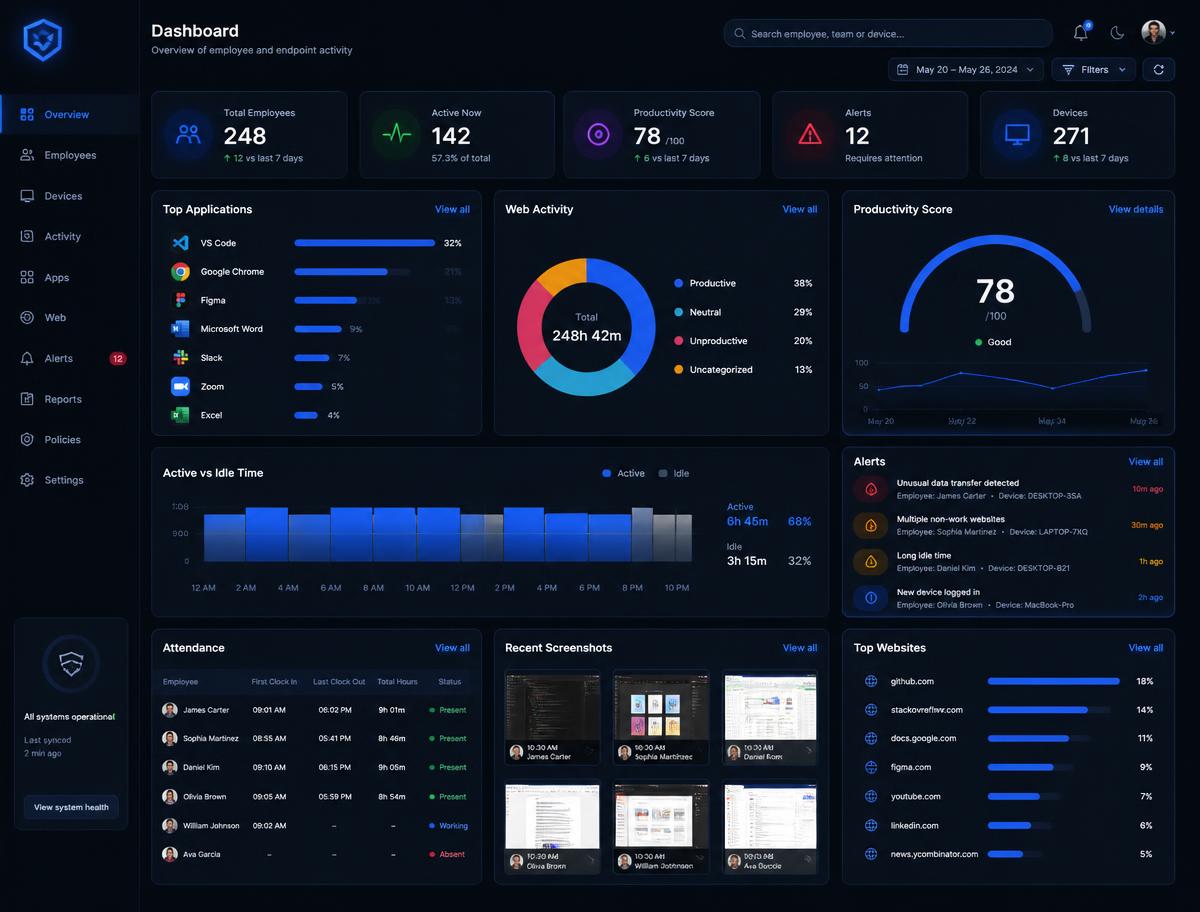
Core capabilities
Everything you need to understand system usage
Six capability areas that turn endpoint signals into decisions your IT, HR, and operations teams can act on.
Activity Tracking
Real-time logging of applications, websites, and active/idle time per user.
Productivity Analytics
Automated scoring and trend reports on individual and team performance.
Screenshots & Session Capture
Scheduled or triggered screen captures for audit and review.
Alerts & Policy Rules
Custom triggers for restricted apps, sites, or off-hours activity.
Attendance & Time Tracking
Clock-in/out, break tracking, and working-hour summaries.
Centralized Dashboard
Single-pane view across users, teams, and departments.
Who it's for
Built for the teams accountable for people, risk, and systems
IT & Security teams
Visibility into endpoint and system usage across the estate.
HR & Operations
Attendance, productivity, and compliance tracking in one place.
Business owners & managers
Oversight of remote or hybrid teams without micromanagement.
Compliance-driven organizations
Audit-ready activity records whenever they are requested.
Key benefits
- Improved visibility into workforce productivity and system usage
- Early detection of policy violations, risk, or unusual activity
- Data-driven insights for resource planning and performance reviews
- Simple deployment across distributed / remote teams
Deployment
A lightweight agent installed on monitored endpoints reports to a secure cloud or on-premise dashboard. Metics supports Windows and macOS environments, with role-based access for admins, managers, and auditors.
New to Myrmetics? Get 30 Minutes, Free.
Book a complimentary consultation with our experts — no obligation, just clarity on your next step.
First-time clients only. No credit card required.
Prefer the full booking page? Pick your time windowChoose Your Next Step
Whatever Stage You're At, There's a Path Forward
Early exploration, active evaluation, or an urgent resourcing gap — pick the route that matches where you are.
Ready to Build What's Next?
Whether you need a Dynamics program, specialist talent, or an advisory partner, we can start with a single conversation.